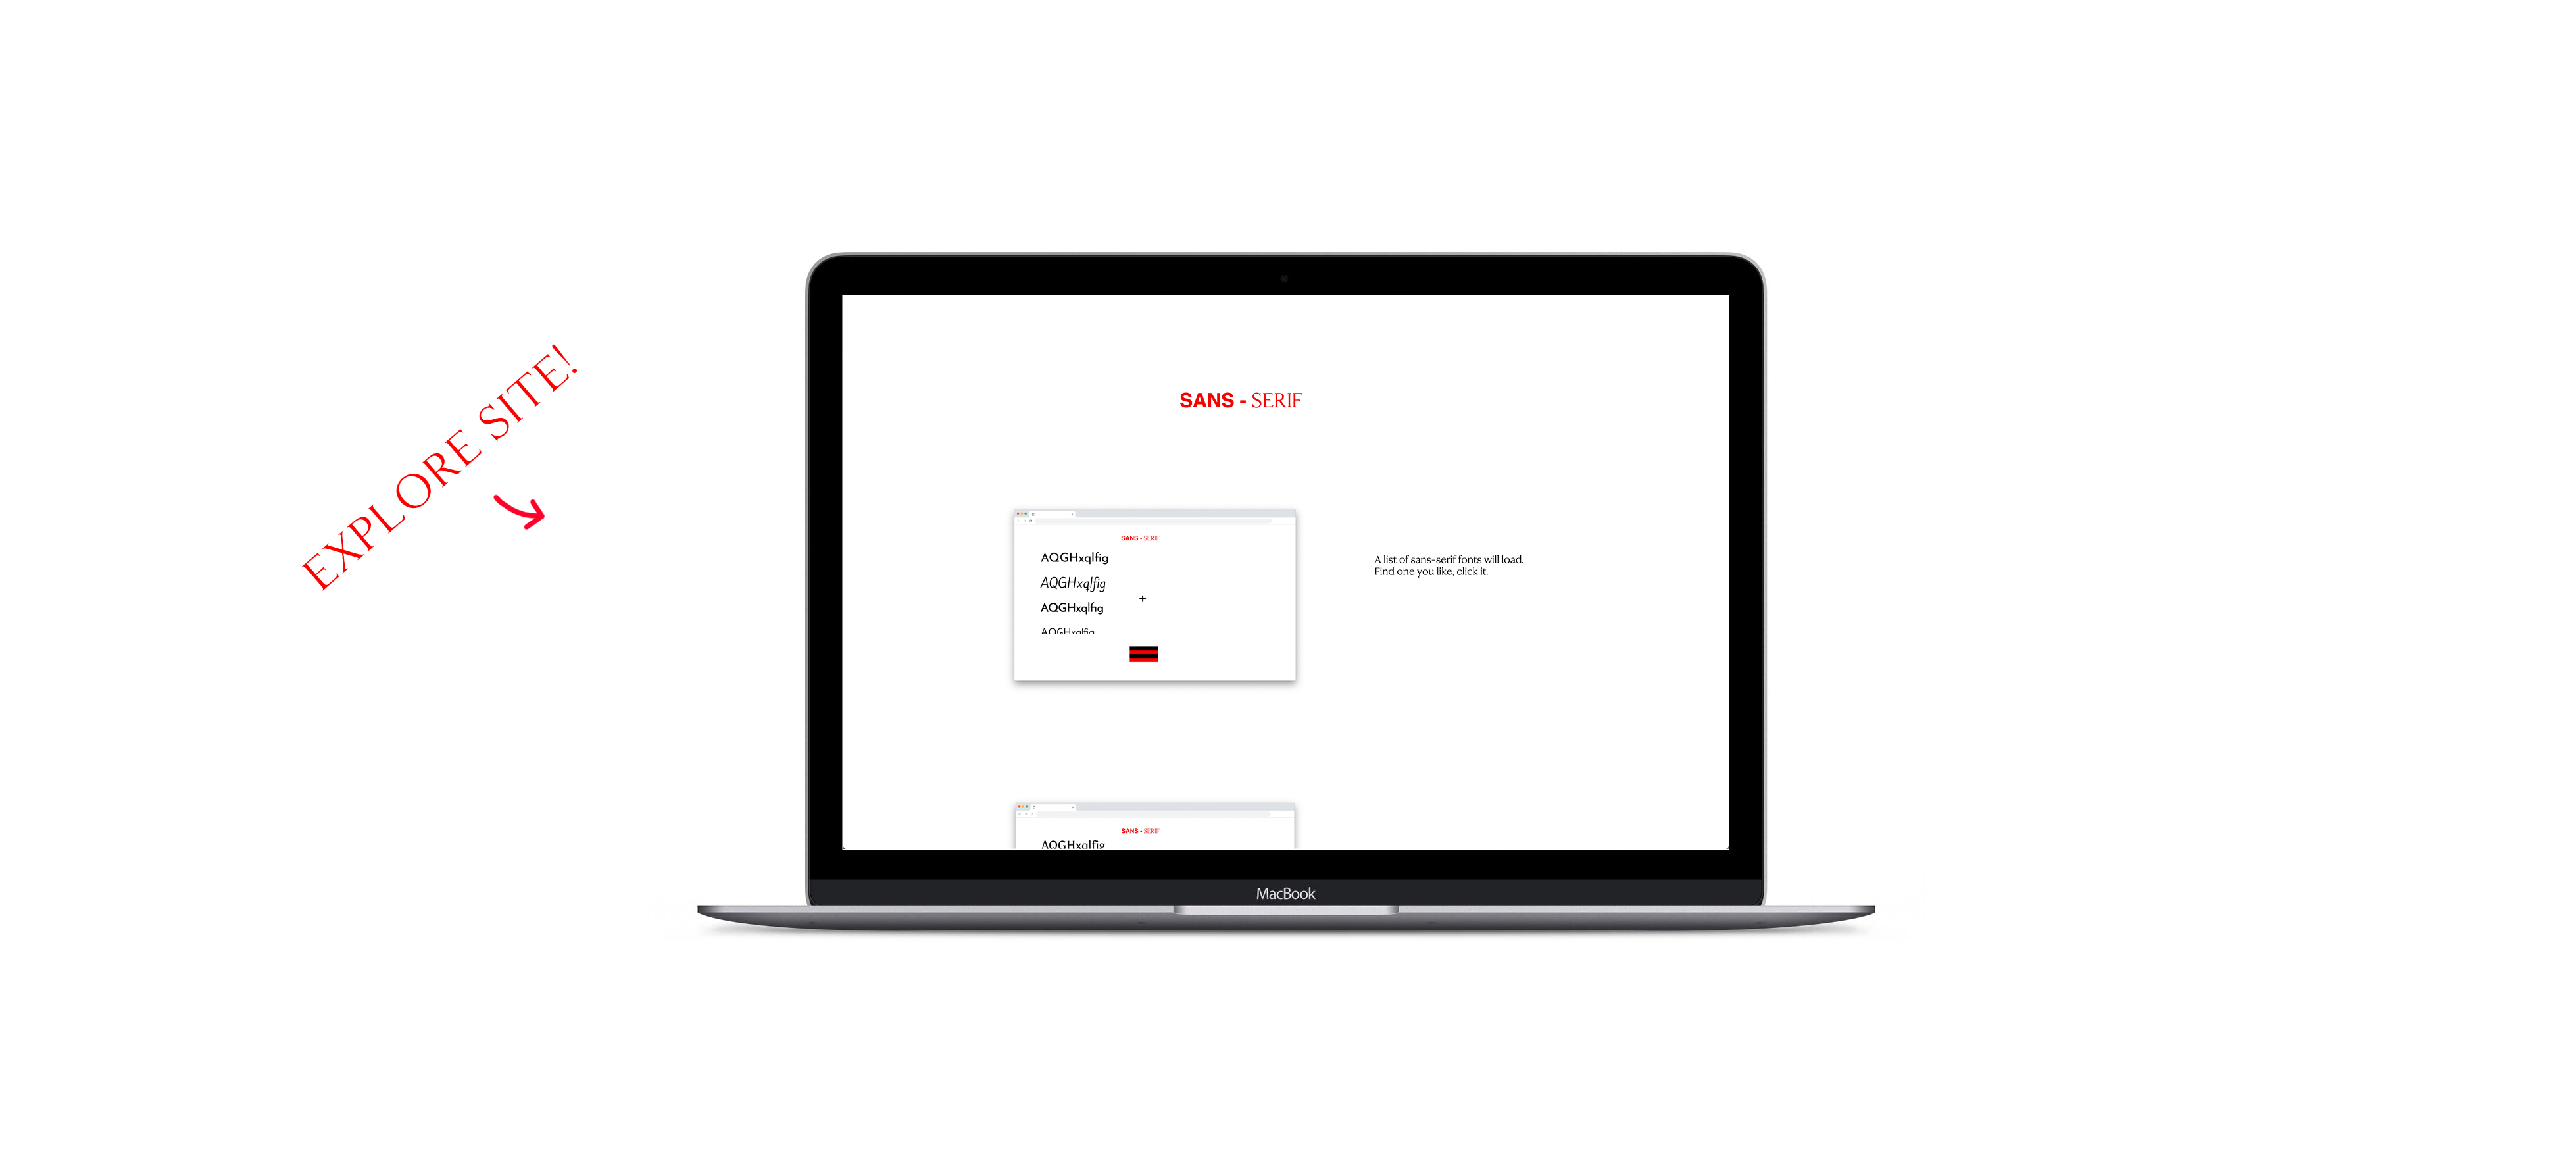
This project was primarily an exercise in figuring out how I could use D3.js for interesting and engaging interaction in the context of some type of data visualization.
Using data sets of Serif and Sans-Serif fonts that allowed for loading and downloading of each font and provided X-height and contrast data points I made a simple font pairing web app.
In an attempt to overcome the inevitably overwhelming experience of a traditional dropdown font picker I used those two data points (X-height and contrast) and simple math to quickly suggest possible serif/sans-serif font pairings.
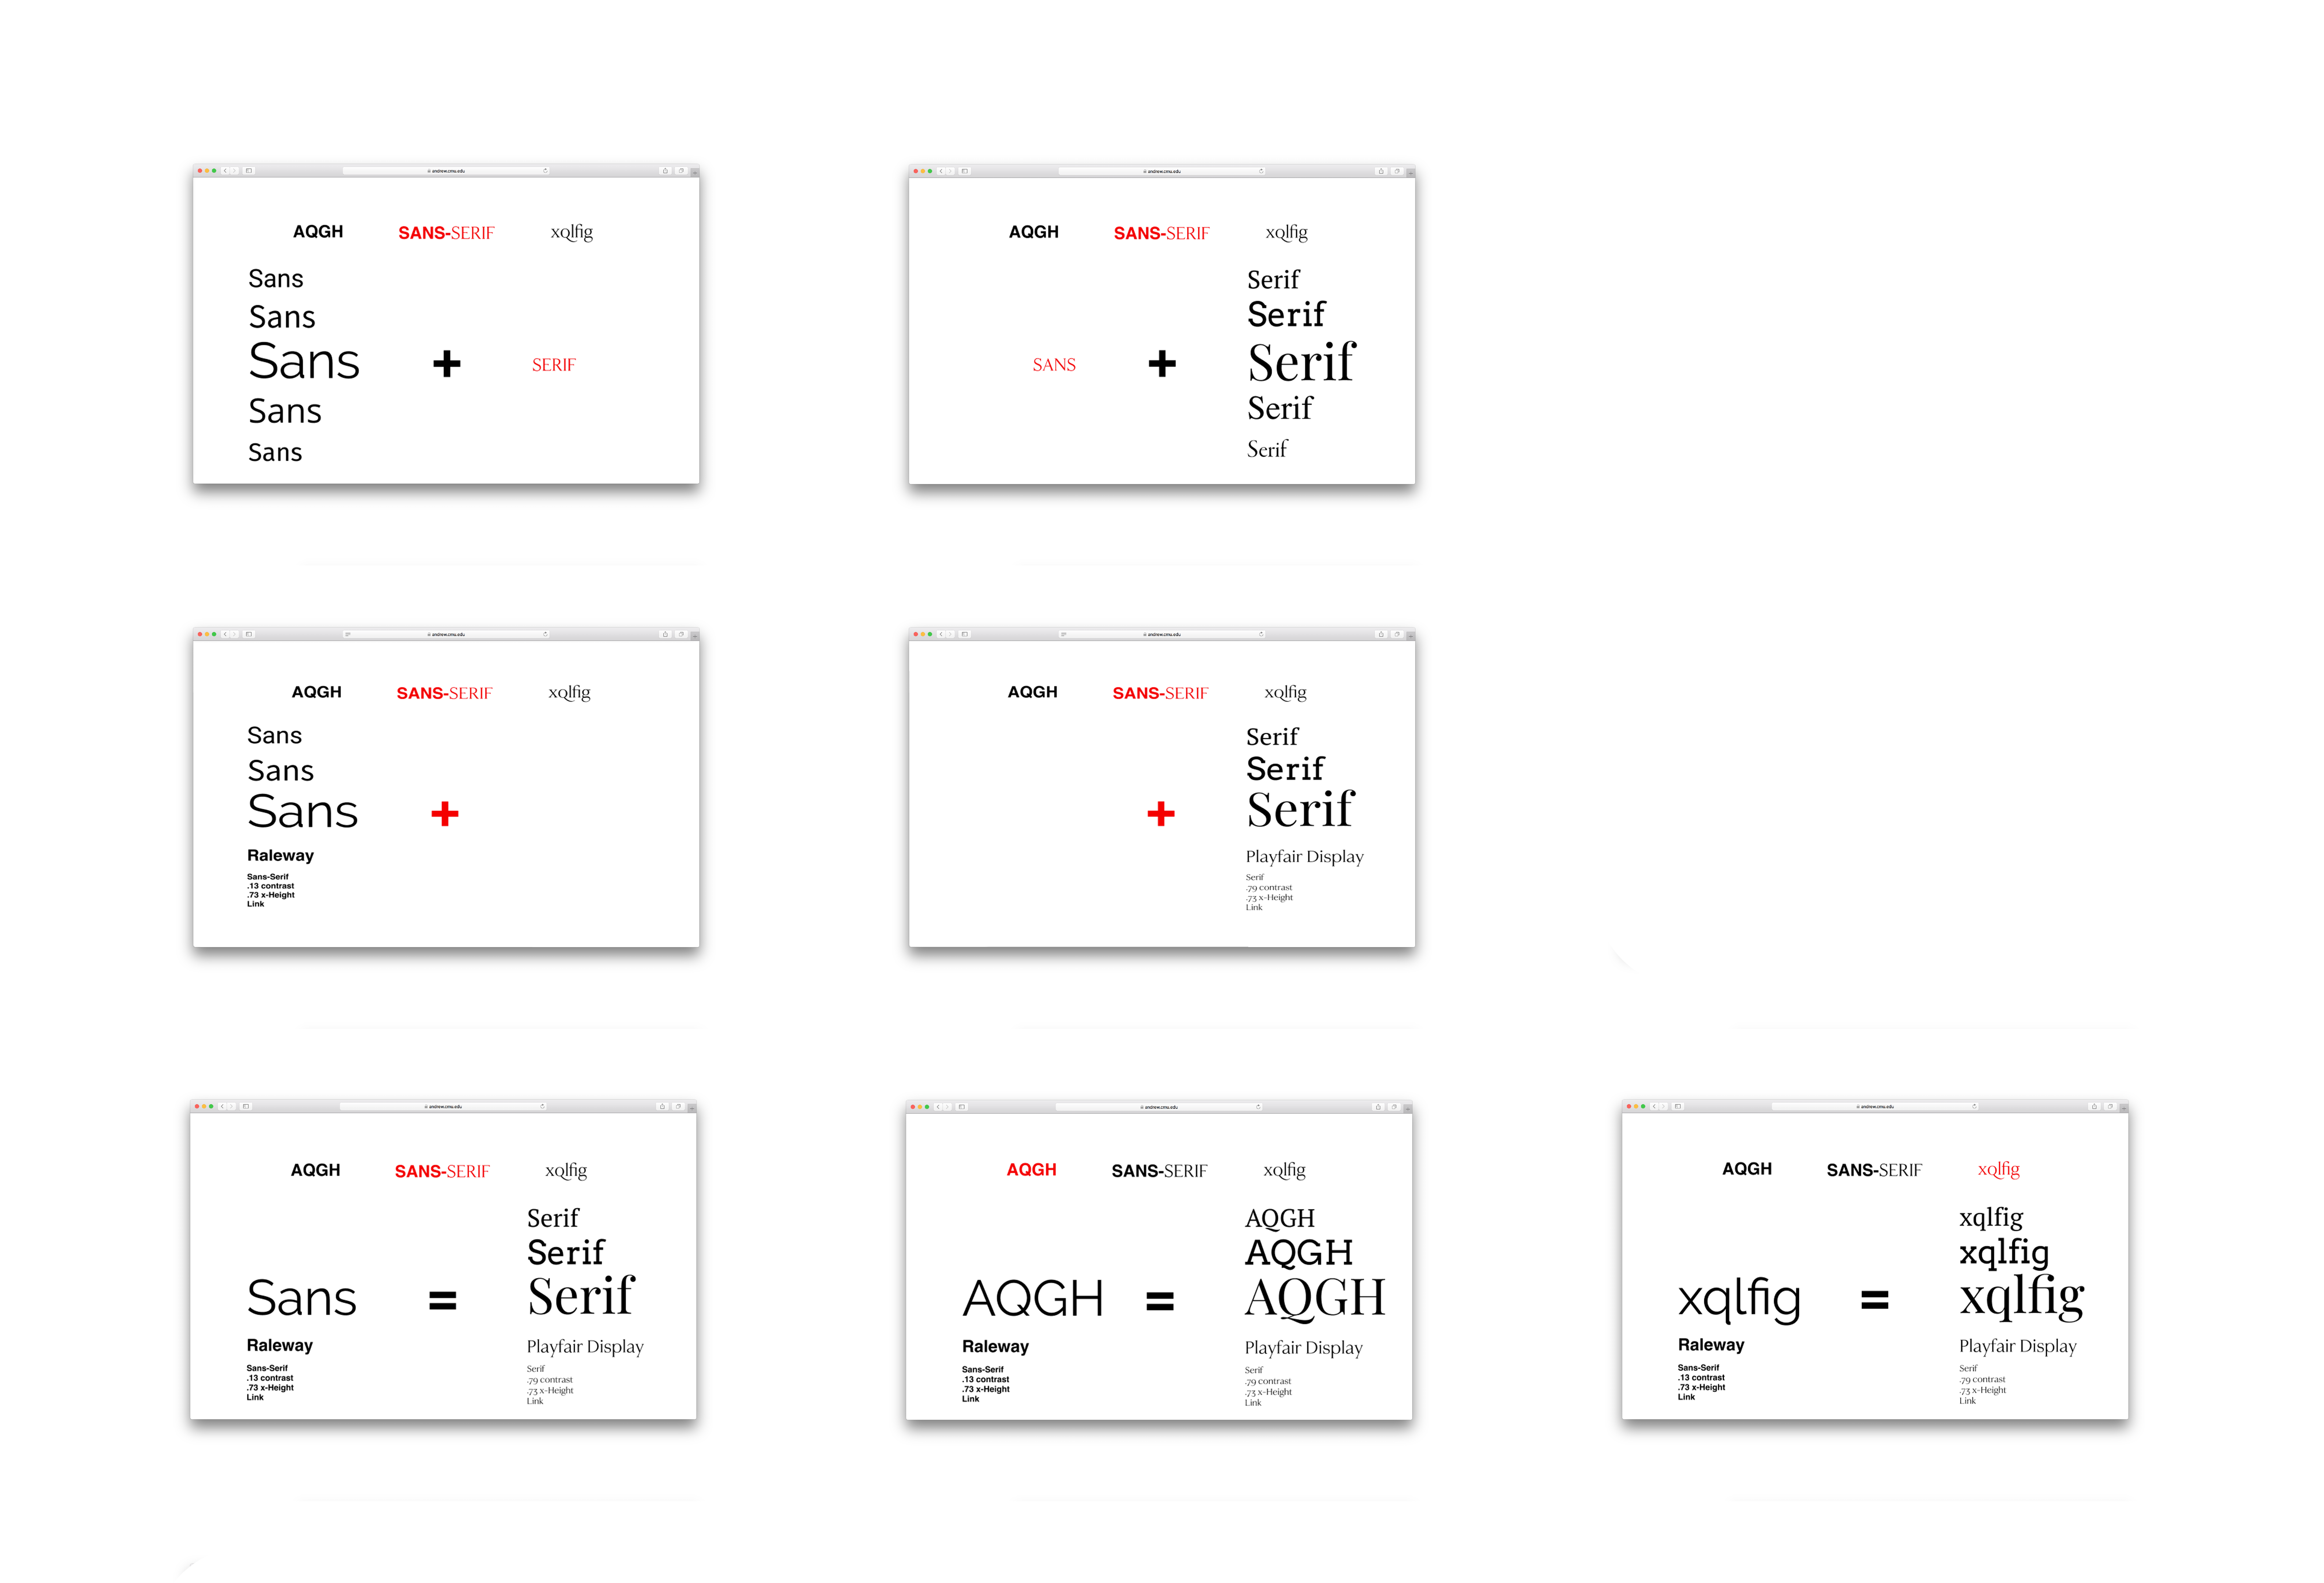
After a sans-serif font is chosen the math eliminates all serif fonts with a different X-height to that of the chosen font from the second data set and displays all possible serif parings. The serif fonts are displayed in either red or black. Black denoting a more appropriate pairing red less so based on the contrast data point. The more appropriate serifs have drastically different contrast while the red denotes too similar. The data set maps contrast on a 0-1 scale and the math denotes an appropriate pair when the difference, in contrast, is >= .25.
This is a working prototype I coded on my own over a long weekend. I've implemented minimal features,
Font pairing interface/algorithm
Font visualization
Font download link
Font info(data)
Scroll interaction
Given another weekend I would aim to implement a few more features,
Font pairing starting from serif or sans
Multiple text visualizations (type your own text to display)
Headline/body visualization for the chosen pairing.

Initital visual prototype.
© 2020 Mason Young-Shor